
Identifying Support Levels
A support level is a price point where demand increases and selling pressure decreases. You'll see price bounce off these levels multiple times before breaking through. It's like a floor — price falls and then springs back up.
To find support, look at the lows on your chart. Find the lowest points where price has turned around. If price touches that same level two or three times and bounces, you've found support. The more times price touches a level without breaking through, the stronger that support becomes.
On the FTSE 100, you'll notice certain round numbers act as support — 7,000, 7,500, 8,000. That's partly psychological. Traders see those numbers and place orders there. Real support, though, comes from where price actually bounced before. That's where the action is.

Finding Resistance Levels
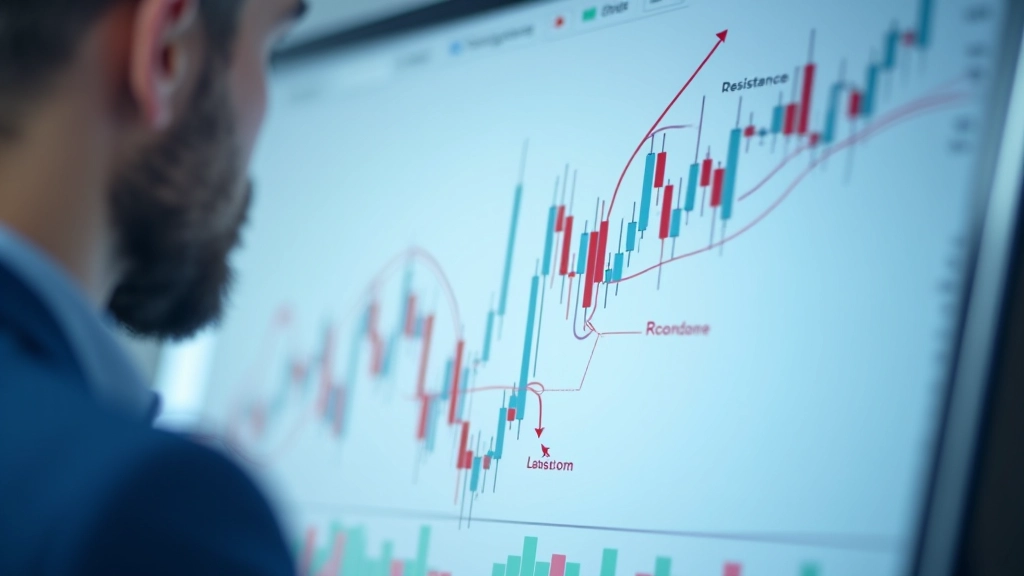
Resistance is the opposite. It's a price level where selling increases and the price struggles to break through. Look at the highs on your chart — those are your resistance points. Price rallies up, hits resistance, and falls back down.
When price approaches resistance, sellers are waiting. They saw that level before, price got rejected there, so they're ready to sell again. It's not guaranteed — resistance can break. But until it does, it's a barrier.
The strongest resistance levels are where price has turned around multiple times. If price has touched 8,500 on the FTSE and failed to break above it five times, that's powerful resistance. Traders remember these levels. New traders place orders there. Volume increases. Price respects it.
How Strong Levels Form
Time Tested
Levels that price has touched 3+ times without breaking are stronger. The more times price respects a level, the more traders believe in it.
Volume Matters
When price touches support or resistance with high trading volume, that level becomes stronger. Volume confirms that traders care about that price.
Time Span
Support and resistance from longer timeframes (weekly, monthly charts) are stronger than daily levels. A level that's held for months is more significant than one that's just held for days.
Trading With Support and Resistance
So how do you actually use this? When price approaches support from above, it's often a good place to consider a long position. Price has bounced there before — it might do it again. When price approaches resistance from below, that's where you might look to exit or go short.
The real money, though, comes from breaks. When price finally breaks through strong support or resistance, that's when big moves happen. Traders who were holding because of that level suddenly have to exit. New traders see the breakout and jump in. Volume surges. Price moves fast.
On the FTSE, if price breaks below a major support level — say 7,400 — that can trigger a cascade of selling. Conversely, breaking above strong resistance can spark a rally. These breakouts are where risk-reward setups get interesting.
Educational Information Only
This article is educational material designed to help you understand technical analysis concepts. It isn't financial advice and doesn't recommend specific trades or investments. Support and resistance are tools — they work best when combined with proper risk management and a trading plan. Market conditions vary, and past price behavior doesn't guarantee future results. Always consult a qualified financial advisor before making trading decisions. The FCA regulates UK trading activities, and it's important you understand the risks involved in any market participation.
Your Next Steps
Support and resistance aren't complicated once you see them. Pull up a chart — any stock or index. Look at the highs and lows. Draw horizontal lines where price has bounced multiple times. That's it. You're identifying support and resistance.
Practice spotting these levels on different timeframes. Notice how levels on daily charts differ from weekly charts. See how price sometimes respects a level for months. This foundation matters because everything else in technical analysis builds on it.
Once you're comfortable identifying these levels, you're ready to explore candlestick patterns and how price behaves near support and resistance. That's the next piece of the puzzle.