Reading Candlestick Patterns on the FTSE
Practical introduction to candlestick formations and what they signal. We focus on the FTSE index with real historical examples.


Why Candlesticks Matter
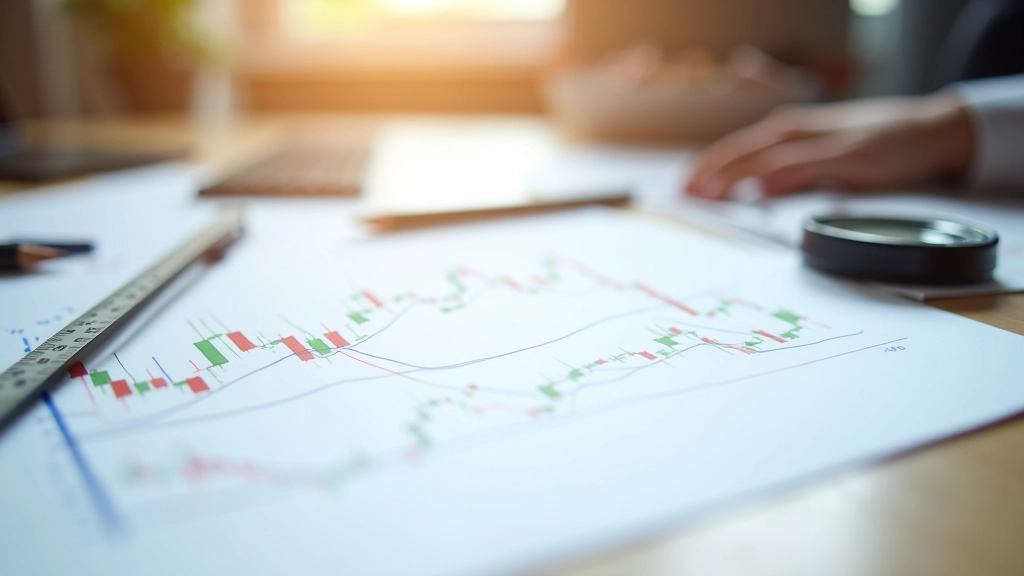
Candlesticks are how price movements get told as stories. Each candle shows you what happened between open and close — the struggle between buyers and sellers in those few minutes or hours. It's not magic. It's not predictive. It's just information presented in a way your brain can actually process.
When you look at the FTSE 100, you're watching one of the world's oldest and most traded indices. The patterns you see here repeat across markets because human psychology doesn't change. Fear and greed drive the same reactions whether we're looking at blue-chip stocks or smaller indices. Understanding candlesticks gives you a common language for what's happening on any chart.
The Core Components
- Open: Where the price started the period
- Close: Where it finished
- High: The peak price reached
- Low: The lowest point hit
Bullish Patterns: When Buyers Are in Control
A bullish pattern signals that buying pressure's winning. You'll see these when momentum's shifting upward or strengthening. The most reliable ones aren't flashy — they're just consistent patterns showing buyers taking control back from sellers.
The Hammer
A hammer has a small body with a long lower wick and minimal upper wick. It looks like a hammer (naturally). What's it telling you? Sellers pushed the price down hard. But buyers came back and closed the candle near the open. That's strength. That's a reversal signal.
The Engulfing Pattern
This one's clearer. A bullish engulfing happens when a small bearish candle gets completely swallowed by a larger bullish candle the next period. The bigger candle's body completely covers the previous candle's body. No ambiguity there. It's momentum shifting.


Bearish Patterns: When Sellers Take Over
Bearish patterns show selling pressure building. They're not doom signals. They're just information. When you see them, it means sellers are pushing back. Sometimes it's temporary. Sometimes it sticks. Context matters more than the pattern itself.
The Shooting Star
Mirror image of a hammer. Small body, long upper wick, small or no lower wick. Buyers pushed the price up. Sellers came back and closed it near the open. That rejection of higher prices is significant, especially if it shows up after a strong run upward.
The Dark Cloud Cover
A bullish candle followed by a bearish candle that opens above it and closes below the midpoint. It's dramatic. It shows sellers not just matching buyers — they're overpowering them. You'll see this pattern in reversals from uptrends.
Pattern Recognition in Practice
Doji Candles
Open and close at nearly the same price. The body's tiny. But the wicks can extend far. What does this mean? Indecision. Neither buyers nor sellers won that period. It's neutral territory. Often appears at turning points.
Marubozu Candles
Strong directional candles with no wicks or minimal wicks. Open at the low and close at the high (bullish) or open at the high and close at the low (bearish). No confusion here. One side controlled the entire period from start to finish.
Morning Star & Evening Star
Three-candle patterns. Morning star signals a bullish reversal (bearish, small neutral, bullish). Evening star does the opposite (bullish, small neutral, bearish). They take time to form but show clear momentum shifts.
The Three-Line Strike
Three candles moving in one direction, then a fourth candle that gaps past all three in the opposite direction. It's dramatic reversal energy. Doesn't happen often, but when it does, it's worth paying attention to the follow-through.
Context Is Everything
A hammer at the top of a 6-month uptrend means something different than a hammer after a 3-day dip. The pattern's the same. The implications aren't. That's why you can't just memorize patterns and expect them to work. You've got to understand where they appear.
Three factors that change everything:
- Timeframe: A daily chart pattern behaves differently than a 4-hour pattern. Longer timeframes tend to be more reliable.
- Volume: A pattern with strong volume behind it carries more weight than one with weak volume. Conviction matters.
- Previous structure: Is this pattern appearing at a support level? Near resistance? After a long trend? After sideways movement? Location changes the story.

How to Practice Pattern Recognition
Reading candlesticks isn't intuitive at first. You need to see hundreds of them before the patterns actually register as patterns. Here's the systematic way to build that skill.
Start with Historical Charts
Pull up FTSE historical data. Go back 6-12 months. Print out a few weeks' worth or keep a spreadsheet. Mark every pattern you recognize. Don't overthink it. Just identify what you see. Compare to the actual price movement that followed. You'll start seeing which patterns actually had predictive value.
Focus on One Timeframe
Don't jump between 1-minute, hourly, and daily charts. Pick one. Most beginners should start with daily charts. They're cleaner, less noise, easier to spot patterns. Once you're solid there, move to other timeframes.
Add Context Gradually
Start simple. Just look at candlesticks. Once that's comfortable, add support and resistance lines. Then volume. Then moving averages. Build your analysis layer by layer rather than trying to use everything at once.
Keep a Trading Journal
Document patterns you see. What pattern was it? Where did it appear? What was the context? What happened next? Over time, you'll notice your own patterns — which setups worked for you, which didn't. That's personal market data worth more than any book.
Educational Disclaimer
This content is for educational purposes only. Understanding candlestick patterns is foundational knowledge for anyone interested in technical analysis. However, recognizing a pattern isn't the same as predicting price movement with certainty. Markets are influenced by countless variables — news, economic data, global events, and sentiment shifts that no pattern alone can capture.
This material does not constitute financial advice, investment recommendations, or trading signals. Patterns can fail. Context matters more than the pattern itself. Past price action doesn't guarantee future results. Anyone considering actual trading should understand the risks involved, consult with qualified financial professionals, and only risk capital they can afford to lose. The FCA regulates UK financial markets, and any real trading activity should comply with applicable regulations.
Moving Forward
Candlestick patterns are a language. You wouldn't expect to understand French after reading one article. You'd need time and practice. Same with charts. The patterns in this lesson — hammers, engulfing, shooting stars, dojis — they're just the alphabet. Real skill comes from seeing them repeatedly and understanding how they fit into the broader price structure.
The FTSE moves on the same psychology that moves every other market. Greed and fear. Buyers and sellers. Strength and weakness. Candlesticks just show you the struggle between these forces in a format you can actually work with. That's their value. That's why they've remained relevant for decades.
Next lesson builds on this foundation. You'll learn how to identify support and resistance levels — the areas where price repeatedly bounces or breaks through. Those levels are where patterns matter most. You'll see why context and structure trump any single candle formation.
Related Lessons